


Taking the Pulse of the Ross Ice Shelf
Principal Investigators
Collaborators & Other Participants
![]()
![]()
Primary support for this project was provided by NSF Polar Programs.

California Dept. of Parks and Recreation provided additional support.
Ice Shelf Resonances
Similar to a very thick open-sided drumhead, ice shelves respond to wave impacts at characteristic frequencies, depending on ice shelf thickness and water depth below the floating shelf (Bromirski et al., 1999; Bromirski and Stephen, 2012). Because the amplitude of swell arriving at the Antarctic coast from local-to-regional storms varies by season (primarily because swell is damped by sea ice during austral winter months), the amplitudes of the dominant resonance frequencies also change seasonally, as seen in the spectrogram below.
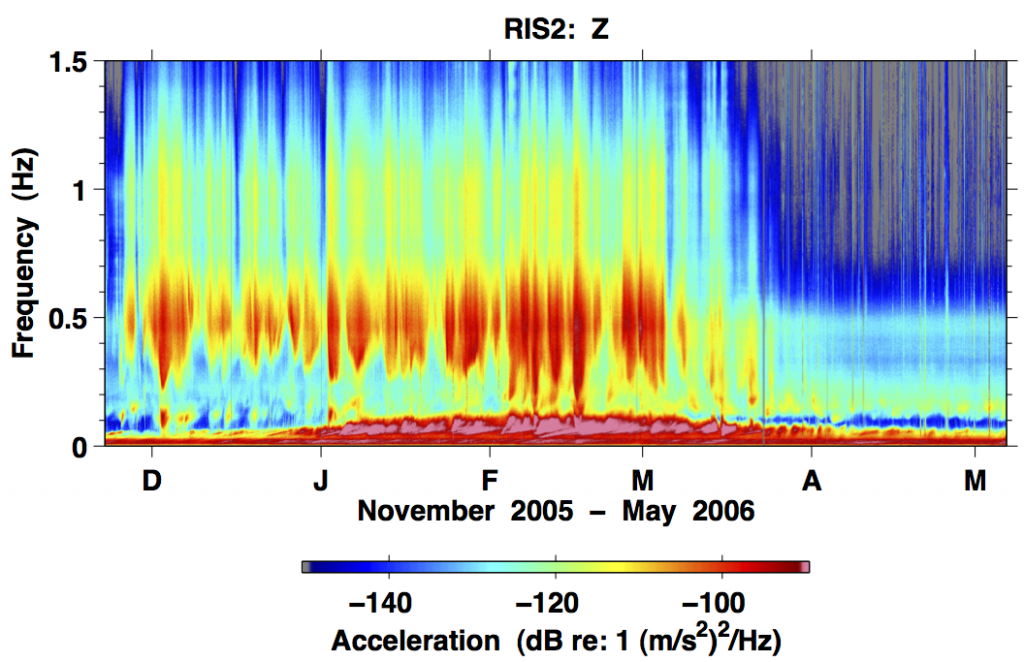
Seasonal changes in the resonance frequencies of Ross Ice Shelf vibrations from austral summer (Dec, at left) through early winter (April, at right), 2005-2006. Vertical axis indicates frequency, and the amplitude of the frequency is indicated by color (highest amplitudes at red/pink end of spectrum). [Click image for larger size.]
Frequencies associated with ocean swell peak from January to March (pink area just under 0.1 Hz, 10-20 second wave period), with accompanying enhancement of associated resonance frequencies (red areas centered around 0.5 Hz). Both classes of gravity waves generate elastic waves when they impact the front of the ice shelf. These elastic vibrations travel through the ice much faster than the gravity waves that caused them. A closer look at the spectral band associated with ocean swell reveals that there are also two types of waves impacting the Antarctic coast: locally or regionally generated swell from relatively nearby storms in the Southern Ocean, and remotely generated swell which may arrive from as far away as the North Pacific. In the spectrogram below, the vertical bands are the ice shelf response (vibrations) to local/regional wave activity. The slanted bands result from remotely generated waves that have become dispersed while travelling over greater distances. The low-frequency (long period, long wavelength) swell travels faster and arrives at the Antarctic coast earlier (bottom of slanted bands) with higher frequency (shorter wavelength) swell following.
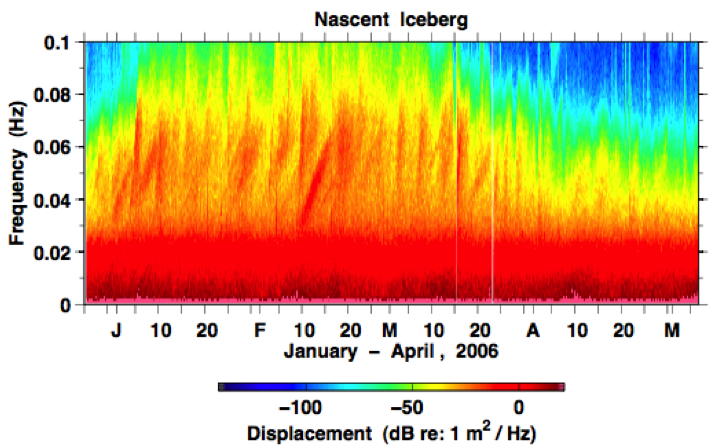
Spectrogram of vibrations on a nascent iceberg at the edge of the Ross Ice Shelf.
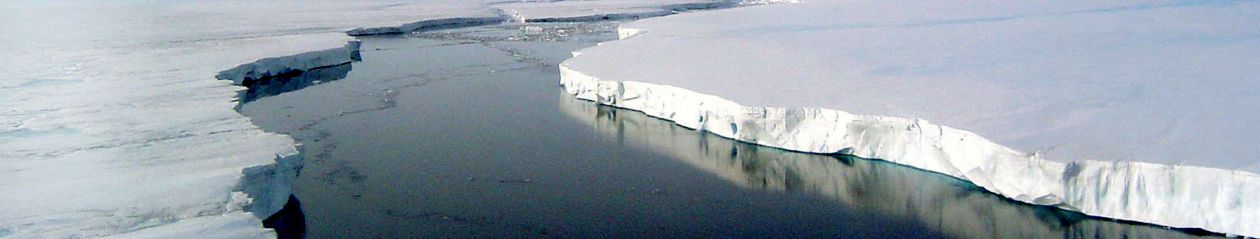
The spectrogram above is obtained from a seismometer near the edge of the Ross Ice Shelf where an expanding rift will eventually cause the formation of a large tabular iceberg, similar to B-15A in 2000. One aspect of this study is to investigate the contribution of ocean swell (gravity waves) and infragravity waves to rift expansion.  Seismometer station at the edge of the Ross Ice Shelf where a nascent iceberg is forming. [Image: Joe Harrigan & Olga Sergienko]
[/caption] A prominent spectral peak in the RIS response centered near 0.5 Hz (black arrow) occurs at frequencies well above the typical upper bound of the gravity-wave band observed for sea swell (about 0.35 Hz; Bromirski et al. 1999). During April when sea ice damps most of swell energy, this spectral peak narrows to its 0.5 Hz center frequency. In the RIS spectra, gravity-wave (swell) activity is characterized by the high amplitude band at frequencies below 0.1 Hz (red arrow). Because the peak near 0.5 Hz is well above swell frequencies, it is not a signal from direct wave impact at the ice shelf edge, but is instead a resonance response associated with the thickness of the shelf and the water layer below.
Seismometer station at the edge of the Ross Ice Shelf where a nascent iceberg is forming. [Image: Joe Harrigan & Olga Sergienko]
[/caption] A prominent spectral peak in the RIS response centered near 0.5 Hz (black arrow) occurs at frequencies well above the typical upper bound of the gravity-wave band observed for sea swell (about 0.35 Hz; Bromirski et al. 1999). During April when sea ice damps most of swell energy, this spectral peak narrows to its 0.5 Hz center frequency. In the RIS spectra, gravity-wave (swell) activity is characterized by the high amplitude band at frequencies below 0.1 Hz (red arrow). Because the peak near 0.5 Hz is well above swell frequencies, it is not a signal from direct wave impact at the ice shelf edge, but is instead a resonance response associated with the thickness of the shelf and the water layer below.
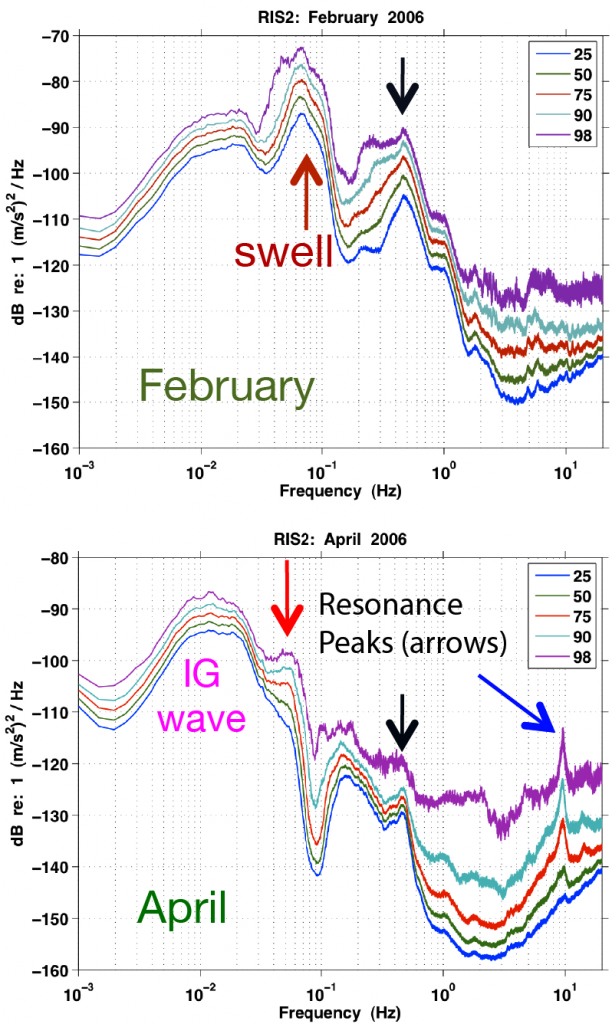
Comparing spectra during the February and April time periods gives an indication of the seasonal persistence of respective resonance bands. Spectra are shown for different percentiles of occurrence; e.g. the spectrum at the 25th percentile (blue) is present 75% of the time, while the 98th percentile spectrum (purple) is only present 2% of the time. There is about a 30 dB drop in swell-band energy levels from February to April, when sea ice damping of swell becomes significant (below, red arrows). Damping also affects the swell-enhanced 0.5 Hz resonance band amplitude (black arrows). However, a smaller peak in the 0.5 Hz resonance band extends into April, suggesting that this band may be related to a resonance/eigen frequency of the RIS that is greatly amplified and broadened by swell, but is present year round. In contrast to swell, the levels in the IG wave band centered near 0.01 Hz (100 second period) remain largely unchanged, indicating that IG waves are not appreciably damped by sea ice. Note the appearance of the 10 Hz peak during April (blue arrow). The source of this peak is unknown, although it is apparently related to seasonally colder weather. The continual operation of the seismic array throughout the winter will greatly clarify the sources and significance of the signals observed.
Bromirski P.D., Flick R.E. and Graham N. (1999). Ocean wave height determined from inland seismometer data: implications for investigating wave climate changes in the NE Pacific. J. Geophys. Res., 104(C9), 20753–20766, DOI:10.1029/1999JC900156. Bromirski, P.D. and R.A. Stephen (2012). Response of the Ross Ice Shelf, Antarctica, to ocean gravity-wave forcing. Ann. Glaciol., 53(60). doi:10.3189/2012AoG60A058.